Pages

Tuesday, June 3, 2014

BQ7: Unit V

Explain in detail where the formula for the difference quotient comes from.
The difference formula is essentially the formula for the slope of a line--more specifically, the secant of another graph. Because of this, we can relate it to the original slope formula, which is (y2-y1)/(x2-x1). Our first step for deriving the difference formula is to find the coordinates of a line that we can apply it to. The graph drawn below illustrates a line and two points on it, which are (x, f(x)) and (x+h, f(x+h)). We use h because it represents the change in x from one point on the x or y axis to another. This is why h is also sometimes known as delta x.


We want to find the slope of this line, so we plug in the two coordinates into the slope formula. After doing this, we are left with: f(x+h)-f(x) over (x+h)-x. This is already looking like the different quotient we know of, and after this we only have to do a little bit of simplifying. The positive x and the negative x will cancel each other out, and so our final answer would be: f(x+h)-f(x)/h. This is how we would derive the difference quotient from the slope formula.

Monday, May 19, 2014

BQ 6: Unit U Concepts 1-8

1. What is continuity? What is discontinuity?
Continuity is when a graph has no breaks, no jumps, and no holes. It is predictable, and you are able to draw it without lifting your pencil from the paper. For a graph to be continuous at a certain point, it must be approaching the same left and right to an existing value and the limit and the value must be the same. On the other hand, a discontinuity is when the graph has a break, jump, or hole. It is the exact opposite of a continuous graph.
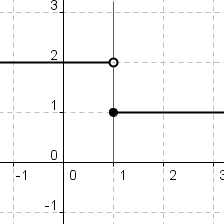
There are four type of discontinuities: point, jump, oscillating, infinite. The point discontinuity falls into the removable discontinuity category. It is essentially an open hole in the graph, and it may or may not have a value at a different height. This discontinuity is shown in the top left picture below. The following three discontinuities are classified as non-removable. The jump discontinuity, as shown on the top middle picture below, is when the graph "jumps" from one point to another, approaching a different point from the left and the right. The two points where the graph jumps can be open and closed or both open, but it can never be both closed. A third type of discontinuity is oscillating behavior, shown on the top right picture below. This is when the graph becomes extremely wiggly, going up and down in a random and unpredictable fashion. Finally, the last type of discontinuity is an infinite discontinuity, which is shown in the bottom picture below. This exists when there is a vertical asymptote and leads to unbounded behavior, where the graph approaches infinity and negative infinity on the side.


2. What is a limit? When does a limit exist? When does a limit not exist? What is the difference between a limit and a value?
A limit is the intended height of a function, meaning the height that the graph is looking like it is going to reach at a certain point. It exists when the graph is continuous or when there is a point discontinuity (the removable discontinuity). In other words, the graph has a limit when it is approaching the same left and right on both sides, does not have unbounded behavior or a vertical asymptote, and does not have oscillating behavior as well.
Similarly, a limit does not exist during the three non-removable discontinuities: jump, oscillating, and infinite. There is no limit at a jump discontinuity because the graph is approaching different points from the left and right. There is no limit at oscillating behavior because it is random and unpredictable, and we cannot determine the intended height. Finally, there is no limit at an infinite discontinuity because the graph has unbounded behavior due to the vertical asymptote.
The difference between a limit and a value is that the limit is the intended height of the function. On the other hand, a value is the actual height of the function. When a graph is continuous, the limit and the value is the same--in other words, the intended height and the actual height are at the same point, which means that the graph is going where it is supposed to.

3. How do we evaluate limits numerically, graphically, and algebraically?
We evaluate limits numerically on a table, where we can visualize the numbers we will use. First, we set it up and put the number that x is approaching in the middle of the x row. On the sides of that number, add values that get increasingly closer to it--for example, if x is approaching 3, put values like 2.9 on the left and 3.1 on the right. Then, plug the function into a calculator, trace the x values that you have chosen, and then fill in the rest of the table (which should just be the y row). Determine what the y values seem to be getting closer to, and that will be your limit.
Next, we evaluate limits graphically by looking at a graph. We put our fingers to the left and right of the point that the problem wants us to find the limit for. If our fingers travel along the graph and meet, then the limit exists at that point. However, if our fingers travel along the graph and do not meet or end up at separate points, the limit does not exist. This means that there is a non-removable discontinuity present.
Finally, we evaluate limits algebraically three ways: direct substitution, dividing out, and rationalizing/the conjugate method. The direct substitution method is simple--all you have to do is to plug in the number that x is approaching into the equation and then solve. However, if you end up with an indeterminate answer, 0/0, then that means that you have to use one of the other two methods: dividing out or rationalizing/conjugate method. Always use direct substitution first before resorting to these two methods. The dividing out or factoring method involves factoring out either the numerator or the denominator to see if anything cancels. This way, we can plug x back into the function after we have cancelled out something so that we don't get another indeterminate answer. The last method is the rationalizing or conjugate method. This is when you multiply the fraction by the conjugate of either the numerator or the denominator. You leave the non-conjugate denominator/numerator factored, and something well cancel out on the top and bottom. After doing this, you will be able to use direct substitution and plug back in x, solving the problem.

Sunday, April 20, 2014

BQ #3: Unit T Concepts 1-3

How do the graphs of sine and cosine relate to each other the others? Emphasize asymptotes in your response.

a. Tangent? The graph of tangent has its asymptotes based on cosine. To understand how this works, one must know that asymptotes are found in a graph when the trigonometric function is undefined. The trig ratio for tangent is sine/cosine, and we know that it is undefined when the denominator is equal to zero. So, if cos(x)=0, tangent becomes undefined, and thus it has asymptotes. Cosine equals zero at pi/2 and 3pi/2, so we know that two of our asymptotes lie there. Also, the positive and negative values of tangent are influenced by sine and cosine. For example, in quadrant two, sine is positive while cosine is negative. When we divide sine by cosine, since it is tangent's ratio, we get a negative value. Thus, we find that tangent is negative in quadrant two, which is true. This method applies for each quadrant around the unit circle.

b. Cotangent? The graph of cotangent has its asymptotes based on sine. The trig ratio for cotangent is cosine/sine, and we know that it is undefined when the denominator is equal to zero (thus giving us asymptotes). So, if sine(x)=0, cotangent becomes undefined, and then it has asymptotes. Sine equals zero at 0 and pi, so we know that two of our asymptotes lie there. Also, the positive and negative values of cotangent are influenced by sine and cosine because of its ratio. For example, in quadrant three, both sine and cosine are positive. When we divide cosine by sine, since it is cotangent's ratio, we get a positive value (a negative divided by a negative equals a positive). Thus, we find that cotangent is positive in quadrant three, which turns out to be true. This method applies for each quadrant around the unit circle.

c. Secant? The graph of secant has its asymptotes based on cosine, since it is its reciprocal. The trig ratio for secant is 1/cosine, and we know that it becomes undefined when the denominator is equal to zero (thus giving us asymptotes). So, if cosine(x)=0, secant becomes undefined, and then it has its asymptotes. Cosine equals zero at pi/2 and 3pi/2, so we know that two of our asymptotes lie there. Also, the positive and negative values of secant are also influenced by cosine, since they share the same ones.

d. Cosecant? The graph of cosecant has its asymptotes based on sine, since it is its reciprocal. The trig ratio for cosecant is 1/sine, and we know that it becomes undefined when the denominator is equal to zero (thus giving us asymptotes). So, if sine(x)=0, cosecant becomes undefined, and there we have our asymptotes. Sine equals zero at 0 and pi, so we know that we have two of our asymptotes there. Also, the positive and negative values of secant are also influenced by sine, since they share the same ones.

Friday, April 18, 2014

BQ 4: Unit T Concept 3

Why is a "normal" tangent graph uphill, but a "normal" cotangent graph downhill? Use unit circle ratios to explain.
The tangent graph is uphill while the cotangent graph is downhill due to their asymptotes, and this is because of their different trig ratios. Tangent's is y/x, while cotangent's is x/y. As we have learned in the previous concepts, asymptotes exist where the trig function of the graph is undefined, or when its denominator is equal to zero. Therefore, tangent would be undefined whenever x=0 (pi/2 and 3pi/2), while cotangent would be undefined whenever y=0 (0 and pi).

Even though the signs may be the same for the two graphs--positive-positive-negative-negative--tangent and cotangent graphs are different because their asymptotes are in different places. Thus, their whole graphs are "shifted" and this results in tangent going uphill and cotangent going downhill according to the signs.

Thursday, April 17, 2014

BQ #5: Unit T Concepts 1-3

Why do sine and cosine NOT have asymptotes, but the other four trig graphs do? Use unit circle ratios to explain.
Asymptotes appear on graphs where the values are undefined, or when a ratio is divided by zero. The reason that the sine and cosine graphs do not have any asymptotes is because, according to their unit circle ratios, none of their values will ever turn out undefined. For example, y/r and x/r are the sine and cosine ratios, respectively, and we know that r always equals one. Thus, these ratios cannot possibly be divided by zero, so they will never be undefined.

However, the cosecant, secant, tangent and cotangent graphs will have asymptotes. This is because their ratios have either x or y as denominators, and there is a possibility of a denominator of zero. Secant and tangent are undefined at pi/2 or 3pi/2 (when x=0), and cotangent and cosecant are undefined at 0 and pi (when y=0).

Wednesday, April 16, 2014

BQ #2: Unit T Concept Intro


How do the trig graphs relate to the Unit Circle?

1. Period? - Why is the period for sine and cosine 2pi, whereas the period for tangent and cotangent is pi? The period for sine and cosine 2pi because, going around the Unit Circle, their patterns take the whole circle to repeat again. For example, sine's pattern is positive positive negative negative. Since there is no clear pattern, we must use the whole Unit Circle to repeat it again and thus, the period is 2pi. The same can be applied to cosine's pattern around the Unit Circle, which is positive negative negative positive. Similarly, it has to be repeated again for a pattern to emerge, so the period for cosine is 2pi (the distance around the Unit Circle). 

Tangent and cotangent, on the other hand, have a clear repeating pattern without having to go all the way around the Unit Circle: positive negative positive negative. We see that "positive, negative" is the repeating pattern and that it repeats itself halfway around the Unit Circle. Then, it starts over again. As a result, the period of tangent and cotangent is only pi, which is half the distance around the Unit Circle.

2. Amplitude? - How does the fact that sine and cosine have amplitudes of one (and the other trig functions don't have amplitudes) relate to what we know about the Unit Circle? Sine and cosine having amplitudes of one relates to the Unit Circle in an important way. First of all, to understand the amplitudes of sine and cosine, we would have to know that the range of the Unit Circle values. They are between 1 and negative 1. And so, with sine having a ratio of y/r--or simply 'y'--the graph's amplitude is limited to one. Thus, the amplitude will remain at one. Cosine, similarly, has a ratio of x/r--or simply 'x', since r is 1--and its graph will have an amplitude of 1.

Thursday, April 3, 2014

Reflection #1: Unit Q: Verifying Trig Identities

1. What does it actually mean to verify a trig identity?
To verify a trig identity means to confirm that both sides of the equation are equal to one another, or that the equation is true. We do this by using different identities that we need to prove the equations that we are given.

2. What tips and tricks have you found helpful?
I have found that converting every trig function to sine and cosine helps when verifying or simplifying. Other tricks that I have found helpful is to split fractions that have monomial denominators to simplify even further or to combine fractions with a binomial denominator. It also helps me to look for greatest common factors to factor out of polynomials in the equation and then possibly use Pythagorean identities to simplify.

3. Explain your thought process and steps you take in verifying a trig identity.  Do not use a specific example, but speak in general terms of what you would do no matter what they give you.
My first step is look for any trig functions that can be converted into sine and cosine, as those are the easiest to work with. If the trig functions are squared in the equation, I would also look for the trigonometric pairs that go with each other: sine and cosine, cosecant and cotangent, and tangent and secant. If I have those, then I would use them instead of converting. I might change one of the trig functions to the other using a Pythagorean identity. However, if I do not have any trig functions squared, then converting everything to sine and cosine is the simplest way.

If I have a fraction, I will look for two things. One of them is if I can multiply the numerator and denominator by the denominator's conjugate. This will work only if I have a binomial denominator and if I can't cancel anything out on the top and bottom anymore. After I multiply in the conjugate, I most likely will end up with a Pythagorean identity, so I can substitute in one trig function and split the fraction if I have to--only if I cannot simplify the numerator and denominator of the fraction first.